Featured Works
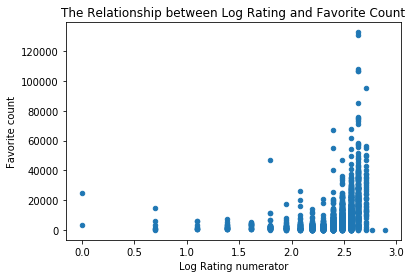
Wrangle and Analyze Data
Description: In this project, I gathered, assessed, cleaned, and analyzed a dataset using python. Finally, I wrote a technical and non-technical report detailing the wrangling steps and the insights respectively.
Skills used: Data cleaning, Data visualization, Report writing
Resources: Python, Numpy, Pandas, Matplotlib, Jupyter notebook
Deliverables: Technical & non-technical reports in HTML and PDF
Completion date: April, 2022
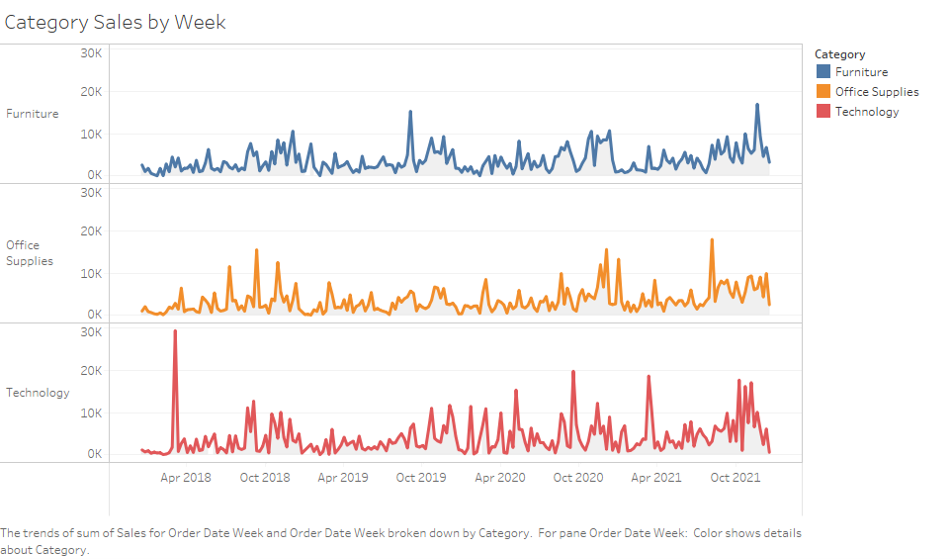
Data Visualization Dashboard
Description: In this project, I explored poverty rates in US Counties (2015) using Tableau.
Skills used: Tableau, Data visualization, Report writing
Resources: Tableau
Deliverables: Tableau web dashboard
Completion date: April, 2022
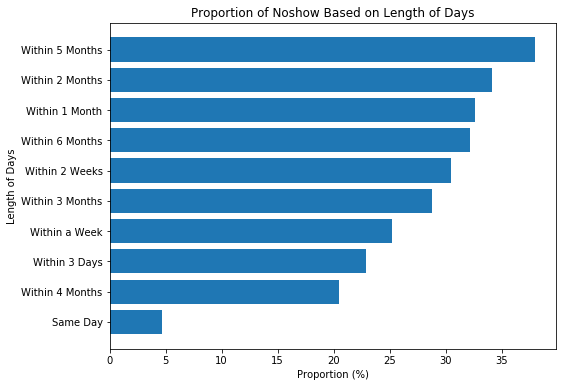
Investigate a Dataset
Description: In this project, I investigated what factors were important in order to predict if a patient will show up for their scheduled appointment.
Skills used: Data analysis, Data visualization, Report writing
Resources: Python, Numpy, Pandas, Matplotlib, Jupyter notebook
Deliverables: Jupyter/Html Report
Completion date: April, 2022
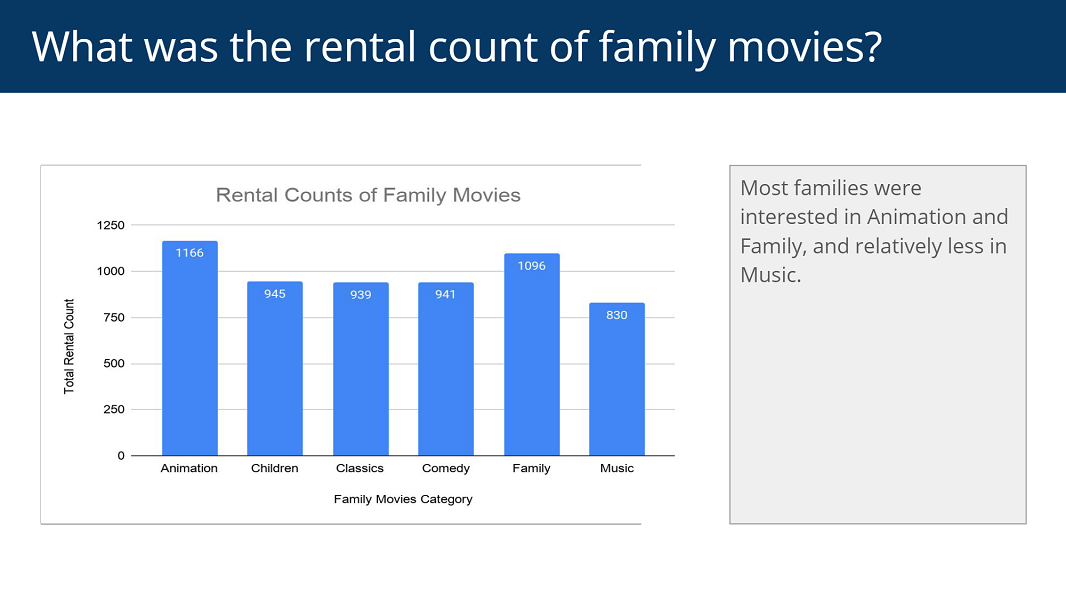
Investigate a Relational Database
Description: In this project, I wrote advanced SQL statements to answer business questions like "Who were the top paying customers?" and "Which movie types (e.g. Animation, Music) were of most interest to families? etc. In the end, I created a report containing visualizations and insights gained from the data.
Skills used: SQL, Data visualization, Data analysis
Resources: Postgres, Excel, Google sheets
Deliverables: PDF Report
Completion date: March, 2021
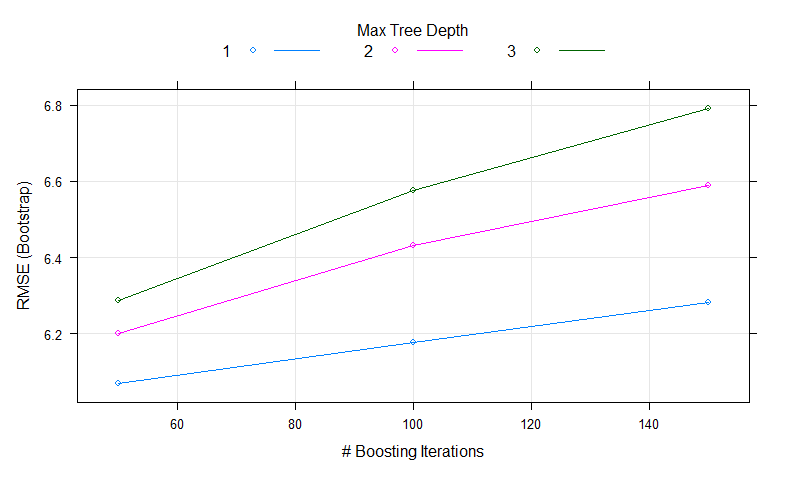
Predicting Electric Tariff
Description: In this project, four ML algorithms - GBM, RF, SVM, and NNET were used to train and predict electricity tariffs. The purpose was to determine the best algorith among the selected
Skills used: Machine learning, Data visualization, Report writing
Resources: R language, Tidyverse, Rstudio, Caret
Deliverables: Word document Report
Completion date: June, 2022
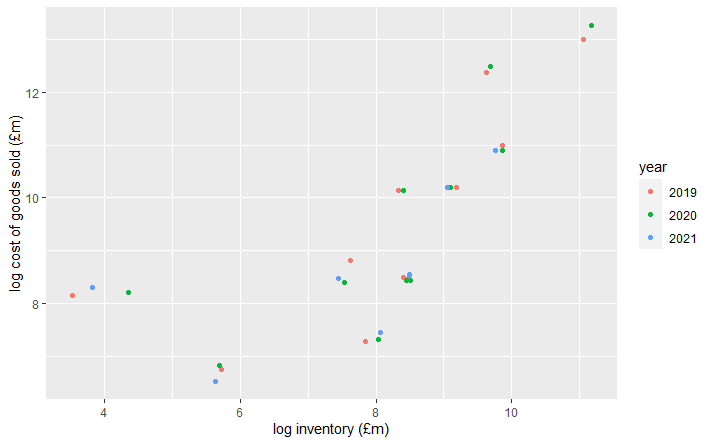
Efficiency Modelling with SFA
Description: I created an SFA Model to determine the efficiency of the inventory management systems of some companies pre and post-COVID-19 period.
Skills used: Modelling, Data visualization, Report writing
Resources: R language, Rstudio
Deliverables: Word document Report
Completion date: July, 2022
Quality Services
-

Data Analytics
I provide data mining, analytic services, etc. I also create reports (including dashboards).
-

Web Development
I also build data-driven applications, APIs and web services.
-

Training & Consulting
I provide training in areas of programming and data analytics
Are you interested in working with me? Let's get started now
 Freelancer.com's
profile
Freelancer.com's
profile


